At the Regional Food Bank, data is much more than numbers on a dashboard—it’s a critical tool that helps us get food to the people who need it most, when and where they need it. By combining internal data like agency order history, with external data like Feeding America’s Map the Meal Gap, we can identify underserved geographies and populations and ensure our resources are distributed as equitably as possible. This data-driven approach allows us to target communities with the greatest unmet need.
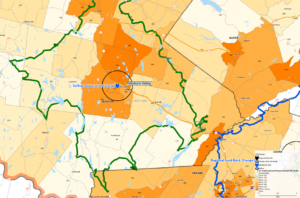
[This is a map created in Maptitude that shows the number of neighbors experiencing Food Insecurity at the census block level (Feeding America’s Map the Meal Gap, 2023). The squiggly shapes around our Thanksgiving distribution sites shown here estimate a 20-minute drive time to the site.]

[We are developing new dashboards using Power BI to allow us to analyze trends in real time. In this dashboard, we can see year over year donations by source.]